
Google’s AI Overviews, along with platforms like ChatGPT, Perplexity, Gemini, and Copilot, are now a major way people discover brands and content, which means traditional “rankings and clicks” alone no longer tell the whole performance story. To understand whether AI Overviews are actually driving value, you need a measurement framework that blends AI visibility, on-site behavior, technical readiness, and brand perception into one coherent view.
AI performance measurement is inherently multidimensional: business impact, technical performance, fairness, and user adoption all matter if you want to scale AI work with confidence. Leading practitioners stress that KPIs must be tied to clear business goals, tracked continuously, and refined over time as models, search interfaces, and user behavior evolve.
Phoenix Premier Digital Marketing & Web Design can help you design this framework end-to-end—from defining AI Overview KPIs to building the dashboards your leadership team will actually use. For a tailored AI measurement plan, call (480) 442-9829 today.
Start With Strategy, Not Screenshots
Before diving into tools, decide what “AI Overview success” means for your organization in concrete terms. For some brands, the priority is net new demand from AI referrals; for others, it is protecting existing organic traffic as AI interfaces reshape SERPs.
A practical first step is to define a small set of AI-specific objectives that ladder directly into existing business KPIs like revenue, lead volume, or customer retention. Research shows that AI KPIs are most effective when they blend technical indicators (accuracy, latency, bias) with business outcomes such as cost reduction, conversion lift, or satisfaction scores. That same principle applies to AI Overviews: you are not just chasing more citations, you are chasing profitable behavior down-funnel.
For example, an e‑commerce brand might define success as “AI Overview visibility for top commercial queries plus higher engagement and conversion rates from AI referrals versus baseline organic search.” A B2B SaaS company might focus on “AI citations around high-intent problem queries, followed by demo requests and pipeline influenced by AI traffic.”
Core Tracking Setup for AI Overviews
Once the strategy is clear, the next step is to instrument your analytics and SEO stack so AI-related performance can be monitored consistently. Most teams will rely on a combination of GA4, Google Search Console, third-party SEO tools, and technical crawlers.
In GA4, treat AI platforms as a distinct channel by tagging AI referrals and building dedicated reports around traffic volume, engagement, and conversions from those sources. Key GA4 metrics include active users from AI referrals, engaged sessions from AI referrals, AI engagement rate, and AI referral conversions and conversion rate. Comparing these side-by-side with other channels helps you understand whether AI traffic is incremental and high quality or just noise.
Google Search Console remains critical for understanding how AI Overviews interact with traditional organic listings. Monitor impressions and click-through rates for queries and pages where AI Overviews appear so you can see whether those features are cannibalizing clicks or introducing discovery opportunities. Over time, this helps you determine which topics deserve AI-optimized content investments and which may need defensive updates to maintain visibility.
Visibility Metrics: Citations, Queries, and Share of Voice
For AI Overviews, pure rankings give way to visibility and citation metrics. Tools like Ahrefs and SEMrush now track AI citations across platforms such as AI Overviews, ChatGPT, Perplexity, Gemini, and Copilot, which effectively function as the new “backlinks” for generative interfaces. The core question is simple: how often is your content chosen as a source when AI systems answer questions in your market?
Useful visibility KPIs include AI citations, competitor AI visibility, AI query keyword growth, audience (search volume tied to topics where your brand is cited), and presence in AI Overview SERP features. AI citations show how trusted your content is by different models, while competitor visibility reveals gaps where rival brands are dominating AI answers you care about. Tracking AI-style queries—long-tail, conversational, question-based terms—helps you tune content to the way users actually prompt AI, not just how they type into classic search boxes.
Share of search style metrics, adapted for AI, are also emerging: they estimate what percentage of topical demand involves queries where your brand appears in AI responses compared with competitors. These are directional rather than precise, but still powerful for benchmarking and prioritization. Combined, visibility metrics tell you whether your AI Overview optimization is expanding reach, protecting your brand, or leaving opportunity on the table.
On‑Site Performance: Making AI Traffic Pay Off
Visibility is only one side of the equation; you also need to understand what happens after the click. GA4 is the best single source for analyzing the behavior and business impact of AI-referred sessions once users land on your site. Here, the focus shifts to engagement, conversion, and content quality for AI landing pages.
Important AI Overview KPIs within GA4 include sessions from AI referrals, engaged sessions from AI referrals, AI engagement rate, AI referral conversions and conversion rate, bounce rate from AI referrals, AI landing page performance, and average engagement time from AI referrals. Comparing engagement and conversion metrics for AI traffic versus organic search, paid search, or social allows you to see whether AI referrals bring higher-intent visitors or just curious browsers.
If bounce rates from AI referrals are significantly higher, it may indicate a mismatch between the AI summary and your page content, which can be resolved by tightening messaging, clarifying offers, or restructuring content for scannability. Conversely, strong engagement and conversion from a specific AI landing page can justify deeper content investment, CRO testing, and link-building to secure and enhance that position.

Technical Readiness: Crawlability for AI Models
Even the best content and KPIs fall flat if AI systems cannot reliably crawl and index your pages. Technical SEO tools like Screaming Frog now include features to evaluate AI model crawl success, especially for user agents associated with platforms such as Google-Extended and ChatGPT-User. A core metric here is the AI model crawl success rate, which shows what percentage of your pages AI crawlers can access without errors or blocking.
Low crawl success can stem from robots.txt rules, authentication walls, or performance bottlenecks that uniquely affect AI user agents. Regularly testing crawlability for AI-specific crawlers ensures that your AI Overview strategy is built on a solid technical foundation, rather than assumptions about what models can see. This is especially important for large catalogs, complex faceted navigation, or sites with heavy JavaScript that may require additional rendering considerations.
Brand and Content Quality Metrics
Some of the most strategic AI Overview metrics are qualitative or semi-quantitative, focusing on brand representation rather than raw traffic. AI systems increasingly synthesize answers without consistently linking or explicitly citing every source, so monitoring how they talk about your brand matters as much as whether they link to you.
Key brand-level indicators include brand mentions in AI platforms, sentiment of AI-generated mentions, semantic coverage score, and answer accuracy and freshness. Brand mentions capture both linked and unlinked references to your organization across AI outputs, providing a more realistic view of true reach. Sentiment analysis highlights whether AI systems are reinforcing outdated or negative narratives that need to be corrected with updated, authoritative content.
Semantic coverage measures how comprehensively your content addresses the entities, subtopics, and questions a model expects to see for a topic, which strongly influences whether your pages are selected as sources. Accuracy and freshness checks reveal when AI tools are returning old or incomplete information about your brand, signalling that pages need updating to maintain prominence. Together, these metrics connect content strategy, reputation, and AI performance into a single lens.
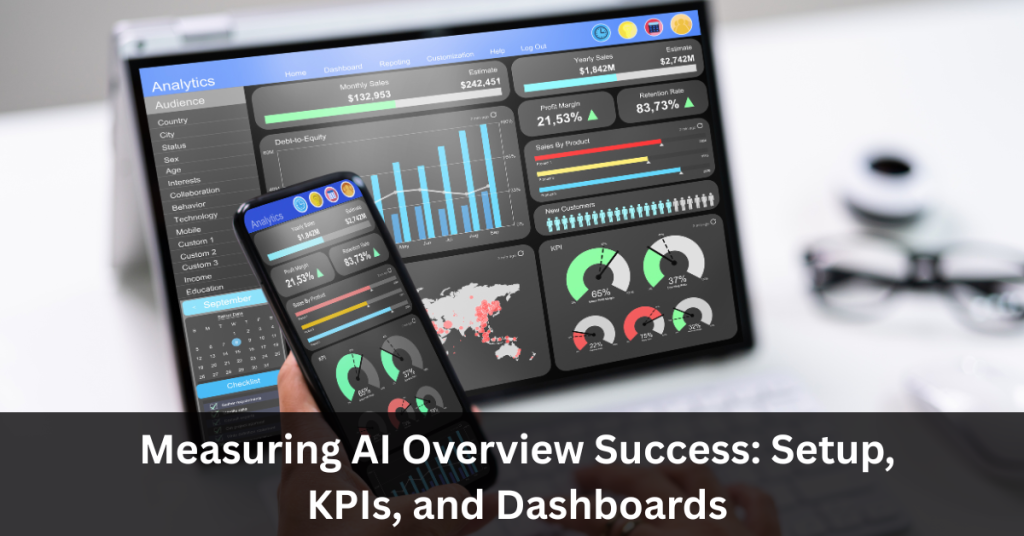
Building Dashboards That Teams Actually Use
With KPIs defined, the final step is to build dashboards that translate a messy multi-tool ecosystem into clean, role-specific views for marketing, product, and leadership. Effective AI Overview dashboards integrate data from GA4, Google Search Console, Ahrefs or SEMrush, and technical crawlers to provide both high-level summaries and drill-down capability.
A common pattern is to maintain an executive overview focused on business KPIs—AI-driven revenue, leads, and cost efficiency—while separate operational dashboards track visibility, engagement, technical health, and content opportunities. Continuous monitoring is essential because AI models, SERP layouts, and competitive behavior change rapidly, which can lead to model drift in performance if left unattended.
One important nuance is that LLM outputs are heavily personalized, which makes AI visibility metrics inherently noisy. As practitioners point out, AI metrics should be treated as directional indicators rather than perfect counts, validated periodically with real-world spot checks. Focusing on trends over time rather than single data points helps teams make confident decisions despite measurement ambiguity.
Phoenix Premier Digital Marketing & Web Design specializes in turning fragmented AI data into clear dashboards and playbooks your team can act on. To get a custom AI Overview reporting stack designed for your business, call (480) 442-9829 and ask about AI search and analytics services.
Common Pitfalls and How to Avoid Them
Organizations often stumble by launching AI initiatives without clear goals, high-quality data, or agreement on what success looks like. Studies highlight that unclear objectives, inconsistent KPIs, and poor alignment across stakeholders are among the top reasons AI performance is hard to evaluate. The cure is to anchor every AI Overview metric to specific use cases, engage cross-functional teams in defining KPIs, and maintain shared dashboards where everyone can see progress in the same language.
Data quality is another recurring challenge: if the information feeding AI systems or your analytics stack is incomplete, biased, or outdated, the resulting metrics will be misleading. Regular data hygiene, bias checks, and governance processes are required to make sure KPIs reflect reality rather than artifacts of flawed inputs. Finally, teams sometimes fixate on raw AI citation counts without considering engagement or conversion; balancing visibility with business outcomes prevents vanity metrics from driving strategy.

Turn AI Overviews Into a Growth Channel
Measuring AI Overview success is ultimately about connecting three layers: where you show up in AI answers, what users do after they click, and how that behavior ladders into revenue, efficiency, or retention. By combining visibility metrics, on-site performance, technical readiness, and brand quality indicators in unified dashboards, you can turn AI Overviews from an experimental curiosity into a predictable growth lever.
Phoenix Premier Digital Marketing & Web Design can architect and implement this full measurement stack for your brand—from GA4 and GSC configuration to AI citation tracking, crawl assessments, and executive-ready dashboards. If you are ready to make AI Overviews a measurable, optimizable part of your marketing mix, call (480) 442-9829 and start building an AI performance framework tailored to your goals.
FAQs
What is an AI Overview, and why is it important?
AI Overviews are generative search features that summarize answers to user queries and display cited sources directly in the search results.
They matter because they reshape how users discover brands, making inclusion in these summaries crucial for visibility, traffic, and conversions.
Which KPIs should I track to measure AI Overview success?
Focus on KPIs like AI citation volume, AI-driven sessions, engagement rate, conversions, and revenue attributed to AI-related traffic.
Combining visibility metrics with on-site behavior and business outcomes gives a fuller picture than rankings or impressions alone.
How do I set up tracking for AI Overviews in GA4 and other tools?
Configure GA4 to segment AI referrals as a distinct traffic source, then monitor engaged sessions, conversions, and revenue from those visits.
Pair this with Google Search Console, SEO platforms, and technical crawlers to track AI visibility, queries, and crawlability end-to-end.
What should my AI Overview dashboard include?
A strong dashboard combines high-level KPIs like AI-driven leads or revenue with detailed views of citations, queries, engagement, and technical health.
Build separate views for executives and practitioners so leadership sees outcomes while marketers can drill into queries, pages, and experiments.
Can Phoenix Premier Digital Marketing & Web Design help implement this measurement framework?
Yes, Phoenix Premier can design your AI Overview strategy, configure GA4 and GSC, and build dashboards that tie AI visibility to revenue and leads.
For a tailored AI analytics setup and reporting cadence, contact Phoenix Premier Digital Marketing & Web Design at (480) 442-9829.